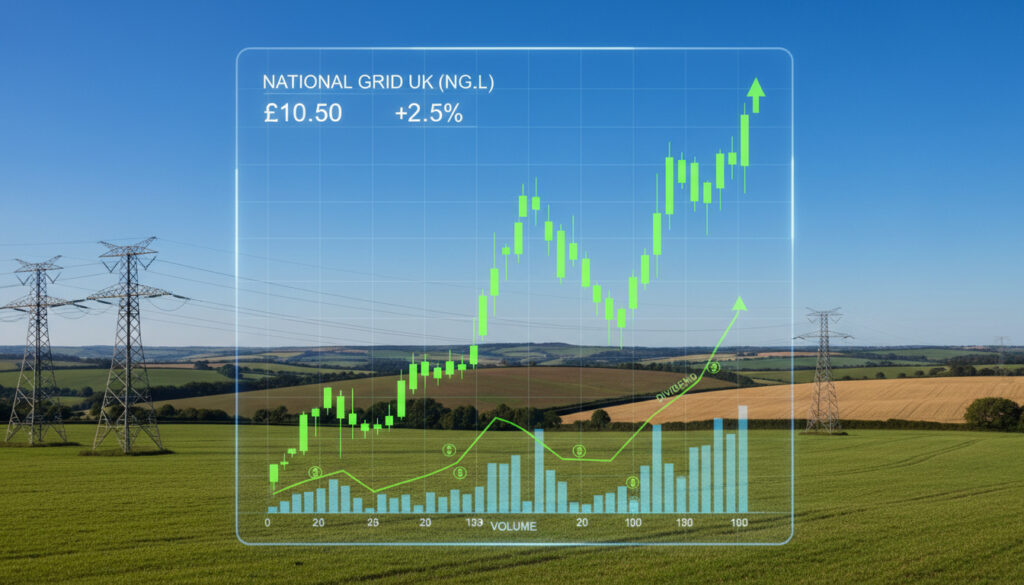
National Grid Share Price UK – Live Data, Charts and Dividends
National Grid PLC (LSE: NG.) serves as the backbone of UK energy infrastructure, with its shares representing a significant component of the FTSE 100 Utilities sector. Recent trading sessions place the stock at approximately 1,296.50p, reflecting a market capitalisation near £64.47 billion and positioning the company as a major player in electricity and gas transmission networks across the United Kingdom and northeastern United States.
Investors tracking the National Grid Share Price Live Data & Charts observe a security that trades with characteristic volume exceeding 1.6 million shares daily, offering liquidity for both institutional and retail participants. The current valuation metrics suggest a premium positioning relative to sector averages, with the shares trading at a price-to-earnings ratio of 22.32 compared to broader utility benchmarks.
The stock’s recent performance indicates resilience amid broader market volatility, posting gains of 25.99% over the trailing twelve-month period. With a dividend yield of 3.54% and a history of consistent distributions, National Grid maintains its profile as an income-focused investment while navigating the complexities of energy transition infrastructure requirements.
What is the Current National Grid Share Price?
- Live Pricing: Bid-ask spreads remain tight at 1,296.00p to 1,296.50p, indicating robust liquidity conditions
- Daily Movement: Shares gained 27.00p in recent trading, representing a 2.13% upward session
- Valuation Metrics: P/E ratio of 22.32 stands significantly above the sector average of 12.0x
- Trading Volume: Recent sessions saw volume of 1,633,129 shares changing hands
- Opening Levels: Session opened at 1,284.00p following a previous close of 1,269.50p
- Price Positioning: Current levels trade substantially above the 52-week low of 949.60p
- Analyst Consensus: Data indicates potential upside of 13.7% based on current fair value assessments
| Metric | Value |
|---|---|
| Ticker Symbol | NG.L |
| Exchange | London Stock Exchange |
| Sector Classification | Utilities – Multi |
| Market Capitalisation | £64.47 billion |
| P/E Ratio (Trailing) | 22.32 |
| 52-Week Price Range | 949.60p – 1,428.50p |
| Dividend Yield | 3.54% |
| Previous Close | 1,269.50p |
| Price-to-Book Ratio | 1.4x (Sector: 1.6x) |
| Day’s Trading High | 1,298.50p |
National Grid Share Price Performance and History
Recent Market Movement
National Grid shares have demonstrated considerable momentum across multiple timeframes. Over the past month, the stock advanced 11.11%, while the three-month horizon shows an 8.66% gain. Six-month returns stand at 17.09%, significantly outpacing broader market indices. The five-year trajectory reveals a 56.43% total return, illustrating the compound benefits of reinvested dividends alongside capital appreciation.
However, daily volatility remains present. Recent data recorded a single-day decline of 0.24% at a time when the FTSE 100 advanced 1.61%, highlighting occasional periods of relative underperformance. Weekly metrics show modest gains of 0.28%, suggesting recent consolidation within the upper trading range.
Recent trading data indicates National Grid shares maintain a tight bid-ask spread between 1,296.00p and 1,296.50p, reflecting robust liquidity conditions typically associated with large-cap FTSE 100 constituents.
Historical Price Boundaries
The 52-week trading range establishes clear support and resistance levels. The year high of 1,428.50p tested in prior months represents a significant premium to current levels, while the 949.60p low provided a foundation during broader market stress. This 479p range demonstrates the stock’s capacity for substantial movement even within a regulated utility framework.
Alternative data providers quote slight variations, with some sources indicating sell prices at 1,260.00p and buy prices at 1,260.50p, reflecting the 15-minute delay common to retail-facing platforms. These discrepancies underscore the importance of verifying timestamp data when executing trades.
National Grid Dividend Yield and Payouts
Current Yield Metrics
The current dividend yield of 3.54% positions National Grid as a viable income vehicle, though yields vary slightly across data providers with alternative measurements suggesting 3.71%. This distribution rate reflects the company’s policy of returning substantial operating cash flows to shareholders while retaining sufficient capital for network infrastructure maintenance.
Dividend reinvestment options remain available through major UK brokerage platforms, allowing shareholders to compound returns automatically. Eligibility extends to standard Dealing accounts, Stocks and Shares ISAs, Lifetime ISAs, and Self-Invested Personal Pensions (SIPPs).
Distribution Calendar
The dividend schedule follows a semi-annual pattern with distinct interim and final payments. The most recent interim dividend of 16.35p per share went ex-dividend on 20 November 2025, with payment to eligible shareholders on 13 January 2026. The preceding final dividend of 30.88p detached on 29 May 2025, settling on 17 July 2025.
| Dividend Type | Amount | Ex-Dividend Date | Payment Date |
|---|---|---|---|
| Interim 2025 | 16.35p | 20/11/2025 | 13/01/2026 |
| Final 2025 | 30.88p | 29/05/2025 | 17/07/2025 |
| Interim 2024 | 15.84p | 21/11/2024 | 14/01/2025 |
| Final 2024 | 39.12p | 06/06/2024 | 19/07/2024 |
| Interim 2023 | 19.40p | 23/11/2023 | – |
Is National Grid a Good Investment and How to Buy Shares?
Investment Accessibility
Acquiring National Grid shares requires a brokerage account with access to London Stock Exchange listings. Major UK platforms facilitate purchases through various account wrappers, with dealing fees typically starting around £6.95 per transaction. The AJ Bell platform and Hargreaves Lansdown both offer comprehensive research tools alongside execution capabilities.
Tax-efficient wrappers provide significant advantages. Stocks and Shares ISAs shield dividends and capital gains from taxation, while SIPPs offer pension tax relief on contributions. The minimum investment typically equals the cost of one share plus dealing charges, though some platforms offer fractional share purchasing.
National Grid shares are eligible for inclusion in Stocks and Shares ISAs, Lifetime ISAs, and SIPPs, with dividend reinvestment options available through major UK brokerage platforms.
Valuation Considerations
The current valuation presents mixed signals. While the 3.54% dividend yield supports income strategies, the P/E ratio of 22.32 significantly exceeds the utility sector average of 12.0x. This premium suggests expectations of continued regulatory stability and infrastructure investment returns. Analyst data indicates potential upside of 13.7%, though this falls below the sector average expectation of 24.4%.
Price data is typically delayed by 15 minutes or more on retail platforms. Figures may vary slightly between sources due to timing differentials and specific market conditions at the moment of capture.
Recent news on 2 March 2026 indicated National Grid boosted its outlook following the implementation of a new pricing framework, potentially supporting future earnings stability. However, comprehensive long-term forecasts remain limited, requiring investors to rely on historical performance patterns and regulatory guidance.
National Grid Share Price Timeline
-
Shares reached a low of 949.60p during broader market stress, recovering to test highs of 1,428.50p -
Interim dividend of 16.35p goes ex-dividend; eligible shareholders entitled to January 2026 payment -
Final dividend of 30.88p detaches from share price; payment follows in July 2025 -
Fiscal year-end reporting: Revenue £18,378m, profit before tax £3,650m, adjusted EPS 55.60p (down 28% year-on-year) -
Prior year final dividend of 39.12p goes ex-dividend, representing the last payment of the 2024 fiscal period -
National Grid boosts outlook following implementation of new pricing framework
Established Facts Versus Market Uncertainties
| Verified Data | Uncertain or Pending Information |
|---|---|
| Current trading price approximately 1,296.50p with 2.13% daily gain | Precise timing of next earnings announcement not yet confirmed |
| Market capitalisation firmly established at £64.47 billion | Short-term price volatility factors remain unpredictable |
| Dividend yield of 3.54% based on declared distributions | Future dividend growth rates beyond current policy |
| Historical EPS data: 55.60p (2025) and 77.70p (2024) | Comprehensive long-term earnings forecasts unavailable |
| Past performance metrics: 1-year return of 25.99% | Exact impact of ongoing regulatory reviews on future returns |
Key Factors Affecting National Grid Share Price
National Grid operates within a tightly regulated environment where London Stock Exchange listings reflect both utility stability and infrastructure investment cycles. Ofgem pricing determinations fundamentally dictate revenue allowances, with the recent March 2026 pricing framework update providing the basis for the company’s improved outlook. Regulatory decisions regarding allowed returns on equity directly impact dividend sustainability and capital expenditure plans.
Energy transition policies represent a dual-edged catalyst. Electrification trends and grid modernisation requirements demand substantial capital deployment, potentially constraining free cash flow in the near term while building long-term asset value. The company’s dual-listed structure through ADRs also creates arbitrage opportunities and volume dynamics between UK and US markets. Interest rate sensitivity remains pronounced, as utility valuations typically compress when risk-free rates rise, though the current 22.32 P/E suggests markets have adapted to the rate environment.
Data Verification and Analyst Perspectives
Financial data aggregators including Investing.com provide comparative metrics showing National Grid trading at 18.5x earnings against a sector mean of 12.0x, with price-to-book valuations of 1.4x sitting below the sector average of 1.6x. This divergence suggests quality premiums offset by asset intensity considerations.
Recent trades on 1 April 2026 included multiple execution lots at 1,296.50p to 1,297.00p, demonstrating sustained institutional interest at current price levels.
Market Execution Data
Primary data sources include AJ Bell Market Research, Hargreaves Lansdown share information services, and direct London Stock Exchange pricing feeds. All figures reflect delayed pricing unless explicitly marked as live. The Leeds United vs Stoke City Championship Standings also track real-time data through similar infrastructure, though unrelated to equity markets.
National Grid Share Price Outlook
National Grid maintains its position as a defensive income vehicle within UK equity portfolios, supported by a 3.54% dividend yield and infrastructure monopoly characteristics. The current share price of 1,296.50p reflects a premium valuation requiring continued regulatory support and successful execution of energy transition investments to sustain. While historical performance shows strong five-year returns of 56.43%, the elevated P/E ratio of 22.32 suggests limited margin for earnings disappointment. Investors seeking utility exposure should weigh the stable dividend history against valuation premiums and the uncertain trajectory of UK energy policy implementation.
Frequently Asked Questions
Where can I access real-time National Grid share price charts?
Live charts displaying 1-day, 1-week, 1-month, 3-month, 6-month, 1-year, 3-year, 5-year, and 10-year views are available through AJ Bell and Hargreaves Lansdown platforms, though data typically carries a 15-minute delay unless subscribed to Level 2 pricing services.
What is National Grid’s current P/E ratio?
The trailing price-to-earnings ratio stands at 22.32 according to recent data, significantly above the utility sector average of 12.0x, indicating a valuation premium relative to peers.
Are National Grid shares eligible for ISA investment?
Yes, National Grid shares qualify for Stocks and Shares ISAs, Lifetime ISAs, and SIPPs, with most major UK brokers offering dividend reinvestment options to compound tax-free returns.
When is the next National Grid dividend expected?
The most recent interim dividend went ex-dividend on 20 November 2025, with payment on 13 January 2026. Future dates typically follow a November/May pattern for interim and final distributions.
How does National Grid’s valuation compare to sector averages?
National Grid trades at 18.5x earnings versus a sector average of 12.0x, and 1.4x price-to-book compared to the sector’s 1.6x, suggesting a quality premium on earnings but slight asset discount.
What was National Grid’s earnings per share for 2025?
For the year ending 31 March 2025, adjusted earnings per share were 55.60p, representing a 28% decline from the previous year’s 77.70p, reflecting increased infrastructure investment costs.
More related posts
 Andy Warhol – Biography Cause of Death Net Worth and Legacy
 Lamps for Living Room – Buyer’s Guide and Tips in 2025
 Aidan Gillen Movies and TV Shows – Complete Filmography and Best Roles
 Post Office Near Me Open Now – USPS Hours and Location Guide
 Now TV Free Trial 30 Days – Facts Offers and Cancellation
 Bee Venom Cream Reviews – Real Results, Ratings and Risks
 18K Gold Price Today – Live Rate and Market Analysis in Iran
 Kilimanjaro Peak – Height, Routes, Difficulty & Safety